
Solar Panel Degradation Rate and Long Term Output Expectations
Understand solar panel degradation rate and long term output expectations, then call (833)-793-7166 for a free solar quote and realistic savings estimate.

By Elena Walsh
Learn more about Solar Panel Installation and Repair for guides, costs, and what to expect.
Compare Solar Panel Installation and Repair Pros Near You

Enter your ZIP code to compare top-rated local professionals and request free quotes.
Your solar panels will not produce the same amount of electricity in year 25 as they did on day one, and that is completely normal. The solar panel degradation rate and long term output expectations are among the most important numbers to understand before you sign an installation contract, because they determine how much you will actually save over the life of your system. A panel that loses 0.5% of its output per year will still generate roughly 88% of its original capacity after 25 years, while a cheaper panel degrading at 0.8% per year will be down to about 80%. That difference sounds small, but it can add up to hundreds of dollars in lost savings and can shift your payback timeline. This guide breaks down real-world degradation rates by technology, explains how production warranties compare to field data, and shows you how to verify your own system's performance over time.
What Solar Panel Degradation Actually Means
Solar panel degradation is the gradual decline in a panel's ability to convert sunlight into electricity. It is caused by physical and chemical changes inside the panel, including UV exposure, thermal cycling, moisture ingress, and the slow breakdown of semiconductor materials. Degradation is measured as a percentage of the panel's original rated output, typically at Standard Test Conditions. A panel rated at 400 watts that degrades by 0.5% per year will produce about 398 watts in year one, 396 watts in year two, and so on.
It is important to separate degradation from other causes of lost production. Soiling, shading, inverter inefficiency, and wiring losses all reduce the electricity your system delivers to your home, but they are not degradation. Degradation refers specifically to the permanent loss of panel capacity over time. Understanding this distinction matters because you can clean dirty panels or trim trees, but you cannot reverse degradation. You can only plan for it.
The solar panel degradation rate and long term output expectations vary by technology, manufacturer, and climate. Premium monocrystalline panels from tier-one manufacturers typically carry warranties guaranteeing at least 85% output after 25 years, while some high-end products promise 92% or more. Real-world field data generally supports these claims, though performance can vary based on installation quality and local conditions. For homeowners comparing quotes, degradation rates are a useful way to separate quality products from budget options that may save money upfront but cost more in lost production later.
Typical Degradation Rates by Panel Technology
Not all solar panels degrade at the same pace. The rate depends on the cell technology, the quality of the encapsulant and backsheet, and how well the panel manages heat. Here is a breakdown of typical first-year and annual degradation rates you can expect from common panel types.
- Monocrystalline silicon: About 2% to 3% in the first year, then 0.25% to 0.5% per year. These panels dominate the residential market and offer the lowest degradation rates.
- Polycrystalline silicon: About 2% to 3% in the first year, then 0.5% to 0.7% per year. Poly panels are less common today but still installed in budget systems.
- Thin-film (CdTe): About 2% to 3% in the first year, then 0.5% to 0.7% per year. Thin-film performs better in high heat but generally has lower efficiency.
- N-type TOPCon and HJT: About 1% in the first year, then 0.25% to 0.4% per year. These are premium technologies with the strongest long-term output expectations.
The first-year degradation is higher than subsequent years because of a phenomenon called light-induced degradation, where the panel's output stabilizes after initial exposure to sunlight. Manufacturers account for this in their warranties, which is why most guarantees start with a first-year threshold and then specify an annual decline. When you compare quotes, look for the warranty's year-25 output guarantee rather than just the annual rate. A panel with a 0.5% annual rate but a weak first-year adjustment may underperform a panel with a slightly higher annual rate and a stronger overall guarantee.
For most homeowners, monocrystalline panels from established manufacturers are the safest choice. They offer a proven track record, low degradation, and strong warranties. If you are considering a smaller or specialty system, such as a 120 volt solar panel setup, check the manufacturer's degradation warranty carefully, because smaller panels sometimes use older cell technology with higher degradation rates.
Warranty Production Guarantees Versus Real-World Field Data
Solar panel warranties come in two main forms: product warranties and performance warranties. The product warranty covers defects in materials and workmanship, typically for 10 to 25 years. The performance warranty guarantees a minimum percentage of original output over time, usually 25 or 30 years. A typical performance warranty might guarantee 92% output at year 10 and 85% at year 25. Premium manufacturers sometimes guarantee 90% or higher at year 25.
Real-world field data generally confirms that quality panels meet or exceed their warranty guarantees. Independent studies of installed systems have found median degradation rates of about 0.5% per year for systems installed after 2000, with newer systems performing even better. However, field data also shows significant variation. Some systems degrade at 0.2% per year, while others degrade at 1% or more. The difference is usually attributable to installation quality, climate, and maintenance rather than the panel itself.
This is why the solar panel degradation rate and long term output expectations should be evaluated alongside installer quality. A poorly installed system with inadequate ventilation or loose connections can degrade faster than its panels warrant. When you request free quotes through a service like FreeSolarPowerQuotes, you can compare not just panel brands but also installer experience and warranty terms. A strong installer will stand behind both the product and the installation, which matters more than a fraction of a percentage point in the degradation rate.
It is also worth noting that performance warranties are usually backed by the manufacturer, not the installer. If a manufacturer goes out of business, the warranty may be difficult to enforce. Choosing panels from tier-one manufacturers with strong financial stability reduces this risk. Your installer should be able to provide the manufacturer's warranty documents before you sign, and you should read the fine print on how claims are handled and what exclusions apply.
How Degradation Affects Payback and Battery Replacement Timing
Degradation directly affects your solar payback period and the long-term value of your investment. When you calculate payback, most tools assume a constant annual production or apply a degradation factor. If you ignore degradation, you may overestimate savings by 5% to 15% over 25 years. That is not a reason to avoid solar, but it is a reason to use realistic assumptions.
Here is a simple framework for incorporating degradation into your payback analysis:
- Start with your system's estimated first-year production from your installer's proposal.
- Apply the manufacturer's warranted degradation rate (for example, 0.5% per year) to estimate production in each subsequent year.
- Multiply annual production by your current electricity rate, adjusted for expected rate increases.
- Subtract any loan payments or lease costs to estimate annual net savings.
- Sum the net savings until they equal your upfront cost to find your payback year.
Most residential systems pay back in 7 to 12 years, depending on local electricity rates and incentives. Degradation pushes the payback date slightly later, but the difference is usually less than a year for quality panels. The bigger risk is choosing a low-quality panel with a high degradation rate, which can extend payback by two or three years and reduce total lifetime savings.
Degradation also matters for battery replacement timing. Solar batteries have their own degradation curves, often losing 2% to 3% of capacity per year. If you size a battery to cover your evening loads, you need to account for both panel degradation and battery degradation. A system that covers 100% of your evening load in year one may cover only 80% by year 10. Planning for this with a slightly larger battery or a generator backup can prevent disappointment. If you are considering battery storage, ask your installer how they model degradation for both panels and batteries in their savings projections.
Factors That Accelerate Solar Panel Degradation
While degradation is inevitable, certain conditions can make it worse. Heat is the biggest factor. Solar panels lose efficiency as temperature rises, and prolonged exposure to high heat can accelerate the chemical processes that degrade cells. In hot climates like Arizona, Texas, and Florida, panels may degrade slightly faster than in cooler regions. Proper mounting with airflow behind the panels helps manage heat.
Soiling and shading also affect performance, though they are not degradation in the strict sense. Dust, pollen, bird droppings, and leaves can block sunlight and reduce output. If soiling is left unchecked, it can cause hot spots, where shaded cells overheat and permanently damage the panel. Regular cleaning and trimming vegetation can prevent this. Shading from new construction or growing trees can also reduce output, so it is worth monitoring your system's surroundings over time.
Other factors that can accelerate degradation include:
- Poor installation quality: Loose connections, inadequate grounding, or improper mounting can lead to moisture ingress or electrical faults.
- Voltage stress: Systems with poorly matched inverters or improper string sizing can stress panels beyond their design limits.
- Extreme weather: Hail, high winds, and snow loads can cause microcracks that worsen over time.
- Lack of maintenance: Infrequent cleaning and inspections allow small problems to become big ones.
If you need help with maintenance or repairs, platforms like Repairmen connect homeowners with vetted local professionals for electrical, HVAC, and general home repairs, which can be useful if your solar system requires service beyond what your installer offers. Keeping your system clean and well-maintained is the best way to keep degradation close to the warranty rate.
How to Verify Degradation Using Monitoring History
Most modern solar systems include monitoring software that tracks production in real time. This data is your best tool for verifying degradation. To check your system's performance, compare production from the same month or season across different years. For example, compare your production in July of year one to July of year five. Adjust for weather differences by looking at multiple years or using a weather-adjusted baseline if your monitoring platform provides one.
Here is a simple process for verifying degradation:
- Export your monthly production data from your monitoring portal for each year since installation.
- Identify the months with the most consistent sunlight (usually summer months) and compare year-over-year production for those months.
- Calculate the percentage decline and compare it to the manufacturer's warranty rate.
- If the decline is significantly higher than expected, check for soiling, shading, or equipment faults before assuming panel degradation.
- Contact your installer or manufacturer if you suspect a warranty claim is warranted.
Keep in mind that year-over-year comparisons can be affected by weather, so a single bad year is not necessarily a sign of excessive degradation. Look at trends over three to five years. If your system is underperforming, your inverter may be the culprit rather than the panels. Inverter efficiency can decline over time, and some inverters have shorter warranties than panels. A qualified technician can test individual panel output and identify whether the issue is degradation, soiling, or a hardware fault.
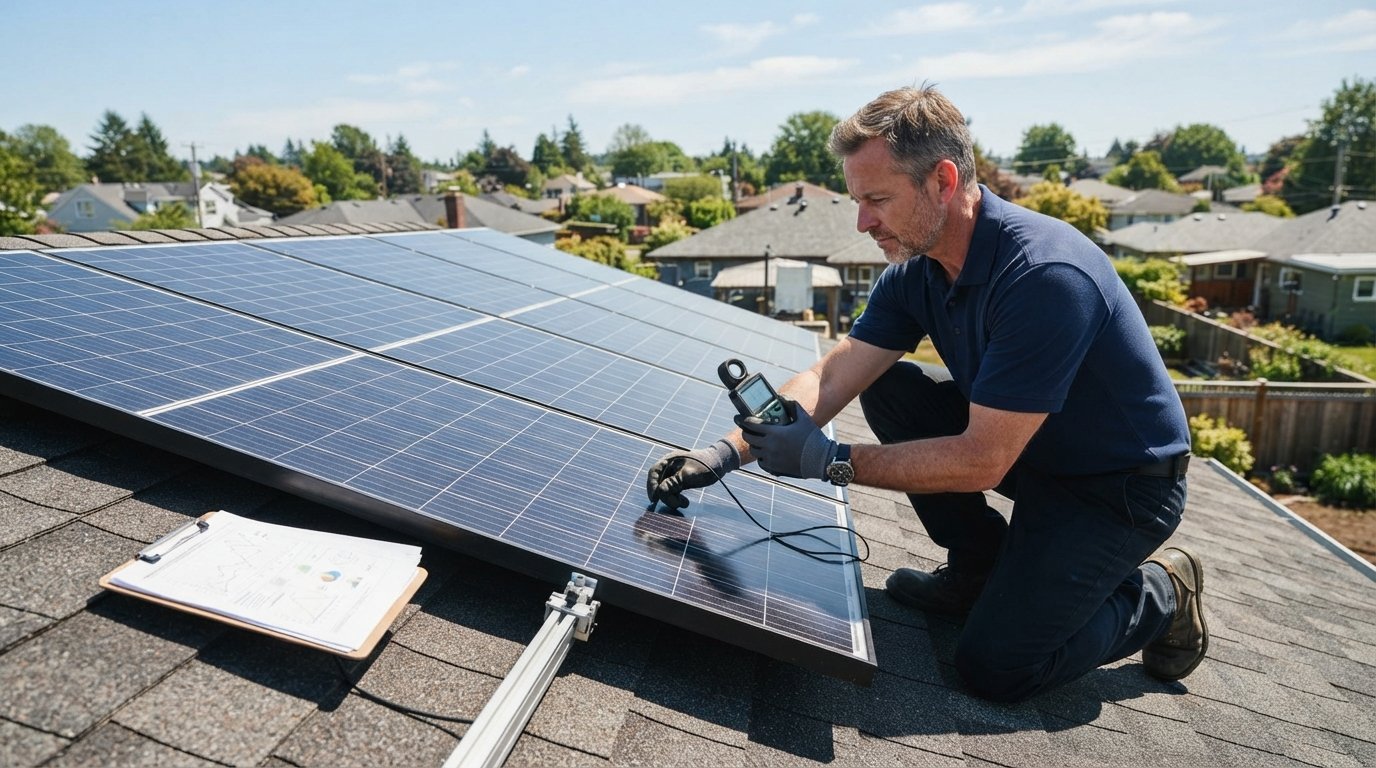
For homeowners who want a professional assessment, many installers offer performance audits. These audits typically include a visual inspection, thermal imaging to detect hot spots, and IV curve tracing to measure actual panel output. If you are preparing to sell your home, a performance audit can also provide documentation of system health, which may be valuable to buyers.
Setting Realistic Long Term Output Expectations
When you evaluate a solar proposal, the solar panel degradation rate and long term output expectations should be front and center. A quality system with monocrystalline panels and a strong performance warranty will typically deliver 85% to 90% of its original output after 25 years. That means a system that produces 10,000 kWh in year one will produce roughly 8,500 to 9,000 kWh in year 25. If your electricity rates rise over that period, the financial value of that production may still be higher than in year one, even with lower output.
It is also important to consider the full system, not just the panels. Inverters typically last 10 to 15 years and may need replacement, which adds to lifetime costs. Batteries, if included, will need replacement sooner. These costs should be factored into your long-term output expectations and savings calculations. A good installer will provide a 25-year cash flow projection that includes degradation, inverter replacement, and maintenance costs. If they do not, ask for one.
Finally, remember that degradation is a gradual process, not a sudden failure. Your panels will continue to produce electricity for decades, and even at 80% output, they are still generating valuable energy. The key is to choose quality equipment, install it properly, and monitor performance so you can catch issues early. By understanding the solar panel degradation rate and long term output expectations, you can make a more informed decision and avoid surprises down the road.
If you are ready to compare quotes from reputable installers who stand behind their products, FreeSolarPowerQuotes can connect you with local providers at no cost and no obligation. Getting a clear picture of degradation rates and warranties before you commit is one of the smartest steps you can take toward a solar investment that pays off for decades.