
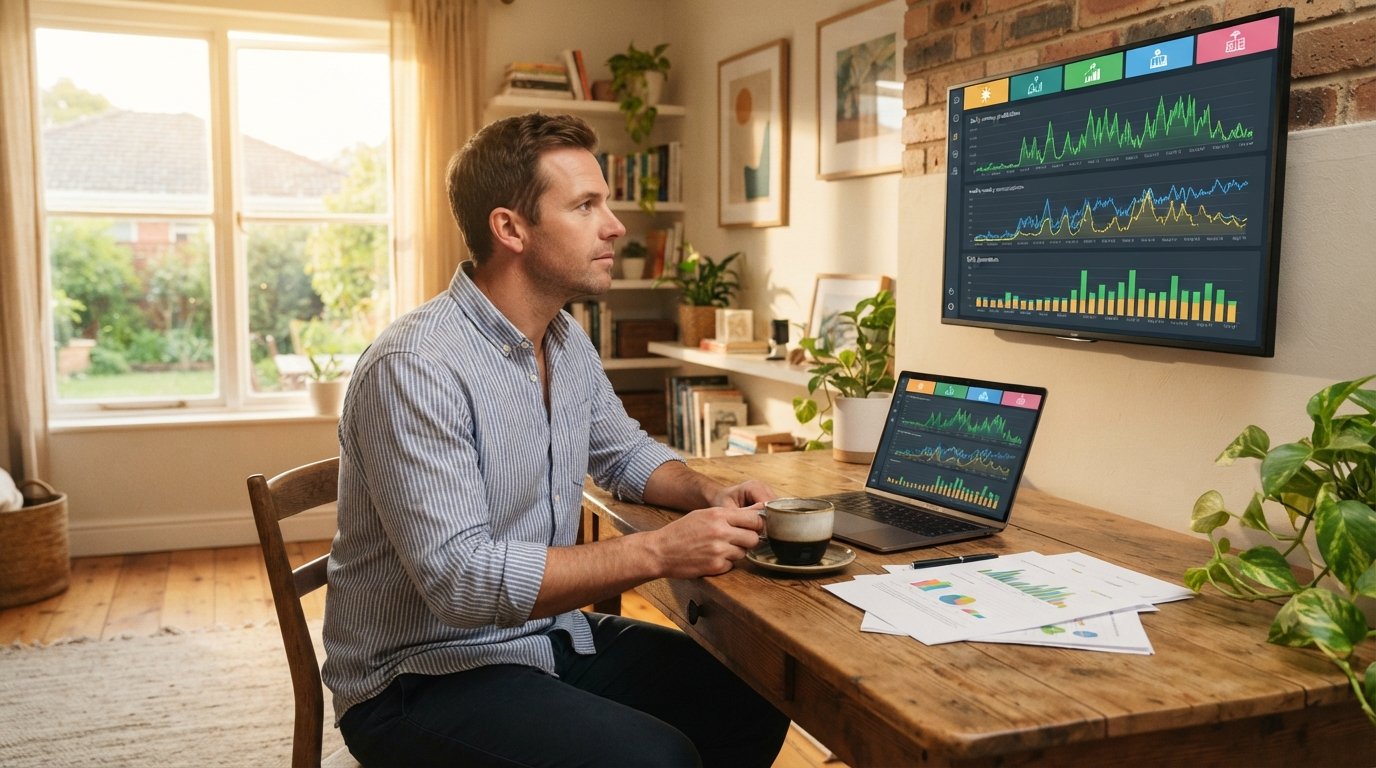
Solar Monitoring Data: Spot Underperformance Early
Learn how to use solar system monitoring data to spot underperformance early and protect your investment. Call (833)-793-7166 for expert guidance.

By Elena Walsh
Learn more about Solar Panel Installation and Repair for guides, costs, and what to expect.
Compare Solar Panel Installation and Repair Pros Near You

Enter your ZIP code to compare top-rated local professionals and request free quotes.
Your solar panels are quietly generating electricity day after day, but are they performing at their best? Without proper monitoring, you could be losing hundreds of dollars annually to undetected underperformance. Solar system monitoring data is your window into the health of your investment, and knowing how to interpret it can mean the difference between catching a minor issue early and facing a major repair bill. In this guide, we will walk you through the key metrics to watch, how to distinguish normal fluctuations from true problems, and the steps to take when your system underperforms.
The Key Metrics That Reveal System Health
When you log into your solar monitoring portal, you are greeted with a dashboard full of numbers, graphs, and charts. It can be overwhelming at first, but focusing on a few core metrics will give you a clear picture of performance. These metrics are the foundation of any solar system monitoring data analysis, and they are what installers use to diagnose issues remotely.
Specific Yield
Specific yield, often expressed in kilowatt-hours per kilowatt (kWh/kW), tells you how much energy your system produces relative to its size. For example, a 5 kW system that generates 25 kWh in a day has a specific yield of 5 kWh/kW. This metric allows you to compare your system's performance to itself over time and to other systems in your area. A sudden drop in specific yield is a red flag that something may be wrong.
Performance Ratio
Performance ratio (PR) is the ratio of actual energy output to the theoretical maximum output under standard test conditions. It accounts for losses due to temperature, soiling, inverter efficiency, and wiring. A well-designed system typically has a PR between 0.75 and 0.85. If your PR starts to decline, it could indicate soiling, shading, or equipment degradation. Monitoring PR over time helps you spot trends and address issues before they become costly.
Daily Peaks and Production Curves
The shape of your daily production curve is just as important as the total energy produced. A normal curve rises smoothly in the morning, peaks around midday, and falls in the afternoon. Any deviations, such as unexpected dips, flat tops, or early shutdowns, can signal problems like inverter clipping, shading, or faulty panels. Many monitoring platforms allow you to overlay curves from different days, making it easy to compare and spot anomalies.
Beyond these three, you should also keep an eye on system uptime, inverter status, and any error codes. Most monitoring systems send alerts for critical faults, but routine checks of these metrics can catch subtle issues that do not trigger alarms.
Seasonal Swings vs. True Underperformance
Solar production naturally varies with the seasons. In most locations, you will see higher production in summer and lower in winter due to shorter days and lower sun angles. These fluctuations are normal and should not be mistaken for underperformance. However, when production drops more than expected for the season, or when your system underperforms compared to similar systems nearby, it is time to investigate.
To distinguish between seasonal variation and true underperformance, establish a baseline. Your installer should provide an estimated production curve for your system based on historical weather data and system specifications. Compare your actual monthly production to this estimate. If you are consistently 10-15% below the estimate for several months, that is a sign of underperformance. Additionally, compare your system's output to that of neighbors with solar panels. If they are producing significantly more, your system may have an issue.
Weather also plays a role. Cloudy days, snow cover, and extreme heat can temporarily reduce output. Keep a log of weather events and see if production recovers afterward. Persistent underperformance despite good weather is a clear indicator that professional attention is needed.
Common Causes of Sudden Production Drops and DIY Checks
When you notice a sudden drop in production, several common culprits are often to blame. Before calling for service, you can perform some simple DIY checks to rule out easy fixes. Here are the most frequent causes and what you can do:
- Soiling and debris: Dust, pollen, bird droppings, and leaves can accumulate on panels and reduce output. Check your panels visually and clean them if necessary (follow safety precautions).
- Shading: New tree growth or construction can cast shadows on your panels. Inspect your surroundings and trim back vegetation if possible.
- Tripped breaker or fuse: A tripped breaker in your electrical panel or a blown fuse in the inverter can halt production. Check your breaker box and inverter for any tripped switches or blown fuses.
- Inverter faults: The inverter may display an error code or be offline. Check the inverter display and refer to the manual for troubleshooting steps.
- Snow or ice accumulation: In winter, snow can cover panels and block production. Gently remove snow with a soft brush (never use sharp tools).
If these checks do not resolve the issue, or if you are uncomfortable performing them, contact your installer. Many problems can be diagnosed remotely through your monitoring system, saving time and money.
For a deeper dive into analyzing your system's financial performance, including how monitoring data feeds into ROI calculations, see our guide on solar system investment analysis.
When to File a Warranty Claim vs. Call for Service
Understanding the difference between a warranty issue and a service call can save you time and money. Most solar panels come with a 25-year performance warranty, and inverters typically have a 10-12 year warranty. If your monitoring data shows a significant and persistent drop in production that is not due to weather or soiling, it may be a warranty issue.
However, not all underperformance is covered by warranty. For example, damage from severe weather, improper installation, or neglect may not be covered. Before filing a claim, review your warranty documents and contact your installer for a diagnostic assessment. They can determine whether the issue is due to defective equipment or other factors.
On the other hand, if the problem is something like a tripped breaker, dirty panels, or a firmware update, a simple service call may suffice. Many installers offer maintenance packages that include periodic inspections and cleaning, which can help prevent issues and keep your system running smoothly.
Questions to Ask Your Installer About Monitoring Access and Data Ownership
Your solar monitoring system is only as good as the data it provides and your ability to access it. Before you sign an installation contract, ask your installer these critical questions to ensure you have full visibility into your system's performance:
- What monitoring platform will be used? Is it a third-party platform or proprietary? Can you access it via a mobile app or web portal?
- Who owns the data? Make sure you have the right to access and export your system's performance data. Some installers or manufacturers may retain ownership.
- What happens if the installer goes out of business? Ensure that the monitoring system will continue to function and that you can transfer access if needed.
- Are there any subscription fees? Some monitoring services require a monthly fee after the initial warranty period. Clarify this upfront.
- How are alerts configured? Can you customize alerts for underperformance, and will you be notified of critical faults?
Having clear answers to these questions will empower you to take control of your system's performance and catch issues early. For more resources on solar education and to explore monitoring solutions, visit SolarEnergy.ai.
Remember, solar system monitoring data is a powerful tool, but it requires regular attention. Set aside time each month to review your production metrics and compare them to expectations. By staying proactive, you can maximize your solar investment and enjoy peace of mind knowing your system is performing at its best.