
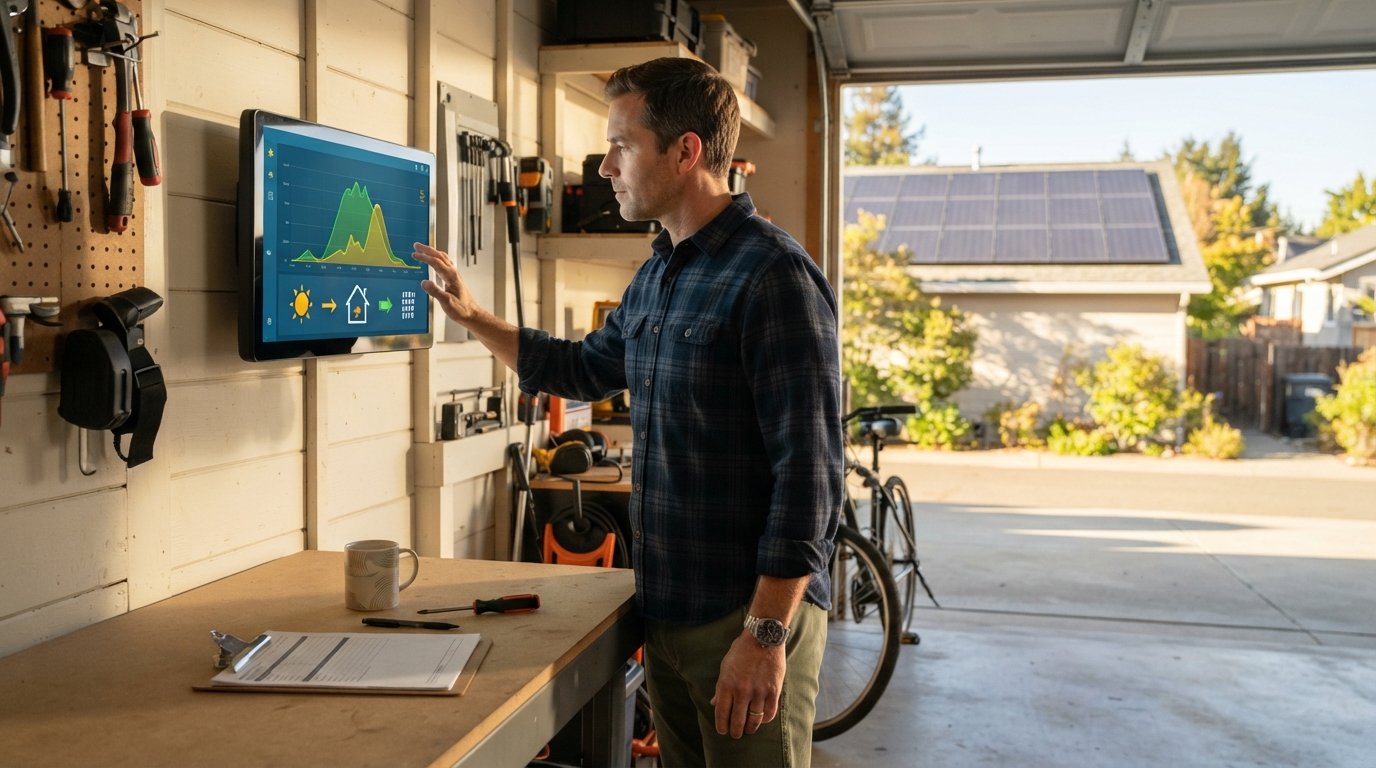
Solar System Monitoring: What Metrics Matter Most
Solar system monitoring what metrics matter most: track production, efficiency, and savings data to catch problems early and protect your investment returns.

By Nathan Russell
Learn more about Solar Panel Installation and Repair for guides, costs, and what to expect.
Compare Solar Panel Installation and Repair Pros Near You

Enter your ZIP code to compare top-rated local professionals and request free quotes.
Your solar panels are quietly generating electricity day after day, but how do you know they are performing at their best? Without proper monitoring, you could be losing hundreds of dollars annually to undetected issues. Solar system monitoring transforms your installation from a set-and-forget investment into a managed asset that delivers predictable returns. Understanding which metrics truly matter helps you catch problems early, maximize energy production, and protect your financial investment for decades.
Why Solar Monitoring Matters for Your Investment
Solar panel systems represent a significant financial commitment, often ranging from $15,000 to $30,000 before incentives for a typical residential installation. When you make that kind of investment, you need visibility into whether your system is delivering the promised returns. Monitoring provides that visibility by tracking real-time performance data and alerting you to anomalies that could indicate equipment failures, shading issues, or wiring problems.
The financial stakes are higher than many homeowners realize. A system operating at 80 percent capacity due to an undetected inverter issue could cost you $200 to $400 annually in lost production. Over a 25-year lifespan, that adds up to thousands of dollars in missed savings. Monitoring systems catch these problems within days rather than months, allowing for quick repairs under warranty.
Beyond catching problems, monitoring helps you understand your system's actual performance against expectations. If your installer projected 12,000 kilowatt-hours annually but you are only seeing 10,500, you need to know why. Was the projection overly optimistic? Is there a shading issue that was not properly modeled? Monitoring data gives you the evidence needed to have productive conversations with your installer. For those still comparing installation options, understanding solar system cost comparison helps frame what performance you should expect at different price points.
Essential Metrics That Drive Solar Performance
Solar monitoring platforms track dozens of data points, but not all metrics carry equal weight for system owners. Focusing on the right measurements helps you identify problems quickly without drowning in technical data. The following metrics form the foundation of effective solar system monitoring.
Energy Production Metrics
Energy production sits at the heart of solar monitoring. This includes instantaneous power output measured in kilowatts and cumulative energy generation measured in kilowatt-hours. Daily, monthly, and annual production totals tell you whether your system is meeting expectations. Comparing current production to historical data for the same time period reveals degradation trends or sudden drops that warrant investigation.
Production ratio, sometimes called performance ratio, compares actual output to theoretical maximum output under ideal conditions. A ratio above 80 percent generally indicates healthy performance. Ratios dropping below 75 percent suggest something is limiting production, whether that is shading, soiling, equipment degradation, or inverter inefficiency. Tracking this ratio over time provides an early warning system for developing issues.
System Efficiency Indicators
Efficiency metrics reveal how well your system converts sunlight into usable electricity. Inverter efficiency, typically between 96 and 99 percent for modern equipment, shows conversion losses at the inverter stage. Panel-level efficiency, when available through module-level monitoring, identifies individual panels underperforming their peers.
Temperature coefficients matter more than many owners realize. Solar panels lose efficiency as they heat up, typically dropping 0.3 to 0.5 percent per degree Celsius above 25 degrees Celsius. Monitoring panel temperatures alongside production helps explain why summer afternoon output sometimes dips despite abundant sunshine. Understanding these relationships prevents unnecessary service calls for normal temperature-related performance variations.
Voltage and Current Measurements
Voltage and current data provide diagnostic insights that production numbers alone cannot reveal. String voltage that falls outside expected ranges may indicate loose connections, damaged wiring, or failing panels. Current imbalances between strings suggest shading issues or equipment problems affecting only part of the array.
These electrical metrics become particularly valuable when troubleshooting. If production drops but voltage and current remain normal, the issue likely relates to environmental factors like clouds or soiling. If voltage spikes or current drops significantly, you have an equipment problem requiring professional attention. Monitoring platforms that display these metrics help you communicate effectively with service technicians.
Environmental Factors That Shape Performance
Solar production does not occur in a vacuum. Environmental conditions dramatically influence how much electricity your system generates, and monitoring these factors provides essential context for interpreting performance data. Without environmental context, you might misinterpret normal variations as equipment problems or miss genuine issues masked by favorable conditions.
Solar irradiance, essentially the intensity of sunlight hitting your panels, serves as the primary driver of production. Monitoring irradiance alongside energy output helps you calculate performance ratio accurately. On cloudy days, low production is expected and normal. On clear days with high irradiance, production should approach maximum levels. Systems that underperform relative to irradiance have problems worth investigating.
Ambient temperature and panel temperature affect efficiency as discussed earlier, but they also influence long-term degradation rates. Consistently high operating temperatures accelerate panel degradation. Monitoring temperature trends over years helps you understand whether your system is aging normally or experiencing premature degradation that might warrant a warranty claim.
Soiling and shading represent controllable environmental factors. Dust, pollen, bird droppings, and leaves reduce production until removed. Monitoring systems that track production against weather data can estimate soiling losses and recommend cleaning schedules. Similarly, tracking production patterns throughout the day reveals shading from trees or new construction that might not have been present during installation.
Financial Metrics That Connect Performance to Savings
While technical metrics matter for system health, financial metrics directly answer the question every solar owner asks: am I saving money? Translating kilowatt-hours into dollars requires understanding your utility rate structure, net metering policies, and time-of-use rates if applicable. Monitoring platforms increasingly integrate these financial calculations to show real savings.
Energy offset percentage reveals how much of your total electricity consumption your solar system covers. A system offsetting 90 percent of usage means you are still buying 10 percent from the utility. Tracking this metric over time shows whether your system is keeping pace with changing consumption patterns, such as adding an electric vehicle or new appliances.
Return on investment tracking combines production data with utility rates and system costs to show how quickly your investment is paying back. Monitoring platforms that display cumulative savings help you see progress toward break-even. For those considering solar, understanding how to evaluate solar options before installation helps set realistic expectations for the financial metrics you will track afterward.
Time-of-use optimization becomes critical in markets where electricity prices vary by time of day. If your utility charges more during evening peak hours, maximizing production during those hours (or storing excess energy in batteries) increases the value of each kilowatt-hour generated. Monitoring systems that break down production by time period help you optimize system operation for maximum financial benefit.
Setting Up Effective Monitoring for Your System
Most modern solar installations include monitoring capabilities built into the inverter or added through separate monitoring hardware. Understanding your options ensures you capture the data needed to protect your investment. The right monitoring setup depends on your system size, budget, and how hands-on you want to be with performance management.
Inverter-level monitoring, included with most string inverter systems, provides system-wide production data. This basic level of monitoring captures total energy generation and flags major equipment failures. However, it cannot identify which specific panel has a problem when production drops. For systems where panels experience varying shade conditions, module-level monitoring provides more granular visibility.
Module-level power electronics, either microinverters or DC optimizers, enable panel-level monitoring. This granular data identifies individual underperforming panels, making troubleshooting faster and more precise. While module-level systems cost more upfront, the diagnostic capabilities often justify the investment for complex installations or those with partial shading.
When evaluating monitoring options, consider these key factors:
- Data granularity: system-level, string-level, or module-level visibility
- Alert capabilities: automatic notifications for production drops or equipment faults
- Data retention: how long historical data remains accessible for trend analysis
- Integration options: compatibility with home energy management systems and utility programs
- User interface: mobile app quality and ease of interpreting displayed metrics
Beyond hardware, consider how you will use monitoring data. Some homeowners check their app daily, while others prefer weekly or monthly reviews. Setting up automated alerts for significant production drops ensures you catch problems even if you do not check the app regularly. Many monitoring platforms allow customizable thresholds for alerts, so you only get notified when something truly warrants attention.
Interpreting Data and Taking Action
Collecting monitoring data is only valuable if you act on what it reveals. Developing a routine for reviewing performance metrics and responding to anomalies protects your investment and maximizes returns. The key is distinguishing between normal variations that require no action and genuine problems needing professional attention.
Seasonal variations are normal and expected. Production drops in winter due to shorter days and lower sun angles. Production increases in summer due to longer days and higher irradiance, though extreme heat can partially offset gains. Comparing current production to the same month in previous years accounts for seasonal patterns and reveals true performance trends.
When you identify underperformance, work through a logical diagnostic process. First, check environmental factors: was it unusually cloudy? Has soiling accumulated? Next, review equipment status: are any error codes displayed? Have any alerts been triggered? If environmental and equipment factors appear normal but production remains low, contact your installer for professional diagnosis.
Keep records of monitoring data and any service actions taken. This documentation proves valuable for warranty claims and helps future service technicians understand your system's history. If you sell your home, monitoring records demonstrate the system's performance and can support your asking price.
For homeowners still in the evaluation phase, understanding what metrics you will track after installation informs your equipment and installer selection. Systems with robust monitoring capabilities and installers who educate owners on performance management deliver better long-term value than those treating monitoring as an afterthought.
Solar system monitoring transforms your installation from a passive investment into an actively managed asset. By focusing on the metrics that matter most, including energy production, system efficiency, environmental factors, and financial performance, you protect your investment and ensure your system delivers the savings you expected. Whether you are comparing quotes before installation or optimizing an existing system, monitoring provides the data needed to make informed decisions and catch problems before they erode your returns.